


Thanks, Baby Boomers: How An Aging Population Can Stress Social Welfare For Younger Generations

Can Americans voluntarily change the Social Security system in order to benefit young and old alike… or will the generations soon be pitted against one another, adversaries in an economic war? Pew Research Center published a new demographic study last week highlighting the “age pyramid” and generational distinctions.
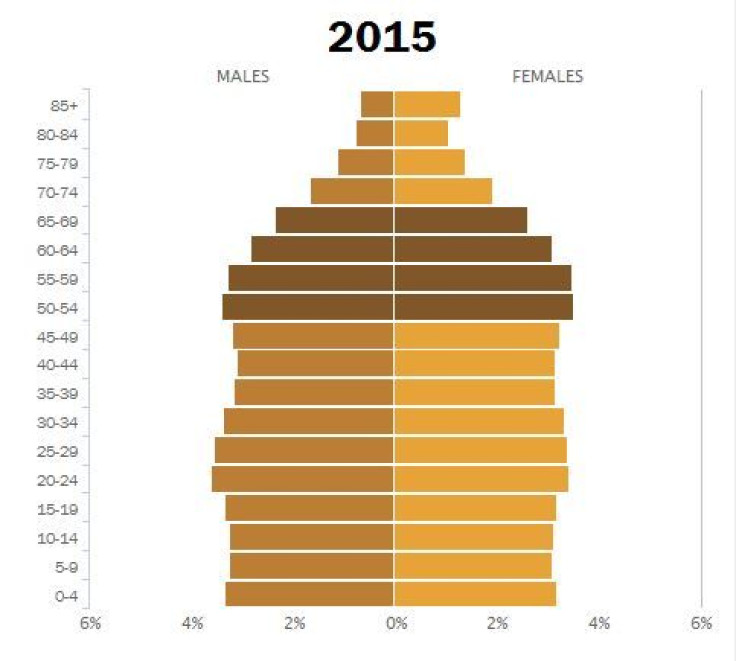
Throughout history, the Pew researchers observed in their latest report, if you broke down a society’s population into five-year age cohorts and created a graph by placing those between ages 0 and 4 at the bottom and those older than 85 at the top, the results would always be displayed as a pyramid. So the researchers at Pew created an interactive graphic of the American population, beginning with the year 1960. Next, they added population data up until today and then they projected into the future.
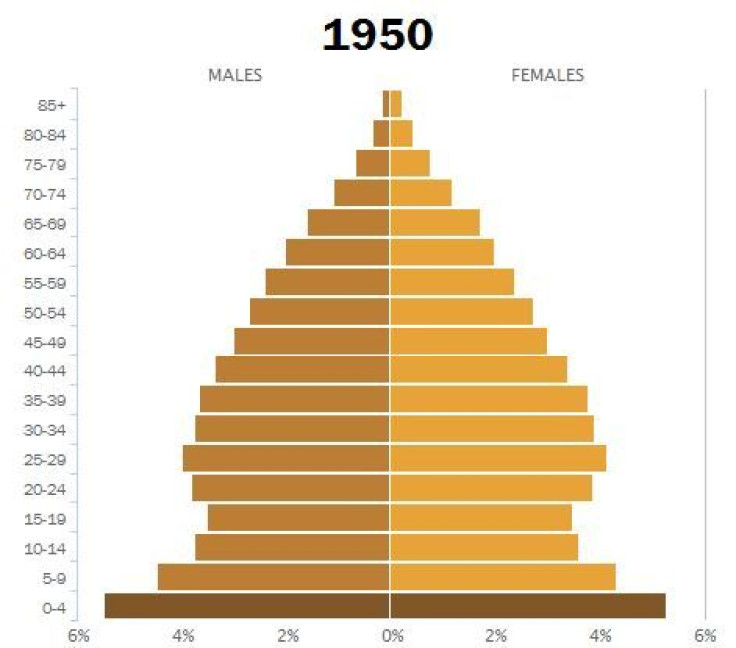
What is immediately obvious is that the pyramid gradually morphs into a rectangle. Longer lifespans and lower birthrates have contributed to this new, “uncharted territory,” the researchers reported; by 2060, if things progress in the manner indicted by these researchers, America will have almost as many people over the age of 85 as under the age of 5.
What is important to note is that the more subtle age-related changes in the population have already placed our public systems under stress. In particular, Social Security and Medicare have become unsustainable as they currently exist. Despite these facts, our politicians rarely address these issues much less make an effort to change the system in order to benefit young and old alike.
A Little History
Originally, the Social Security Act of 1935 was named the Economic Security Act, but while being reviewed in Congress, the title changed. President Franklin Roosevelt signed the Act into law in August of 1935 and beginning in 1937, the U.S. government began to collect the necessary taxes to pay for it. Regular ongoing monthly benefits started in January 1940. The program made perfect economic sense in its earliest years. In 1945, for instance, there were 42 workers for every beneficiary. Yet by 1950, that ratio began to diminish. In that year, the number of workers to beneficiaries had already dwindled dramatically: 16-to-1. Today, the change in that fundamental ratio is radical: 3-to-1. There are only three workers for each beneficiary as of 2010.
Yet, that is not really the whole picture because it includes government workers, who, though they contribute to the Social Security system, are paid by taxes. In reality, there are only 1.75 full-time private sector workers for each beneficiary, according to a CNS News report. The current ratio, even when erring on the side of optimism, is more like 2-to-1.
Medicare, which began as an amendment to the Social Security Act in 1965 under President Lyndon Johnson, is the federal health insurance program for people who are 65 or older as well as some younger people. This also represents a financial burden for workers. And beneficiaries are not just older retirees but disabled workers and survivors as well. That said, between now and 2030, some 10,000 retirees will be going on Social Security and Medicare every single day and soon enough, America will have just two workers per beneficiary, according to Pew, which does not subtract government workers from its calculated ratio. In actuality, then, by 2030 there very well may be more beneficiaries than workers.


