


Facebook's Relationship Statuses Offer Data Showing Which Months People Are Getting Dumped The Most

If you’ve ever waited until after Valentine’s Day to call it quits with your significant other, that’s normal, according to a breakup chart based on Facebook relationship status updates.
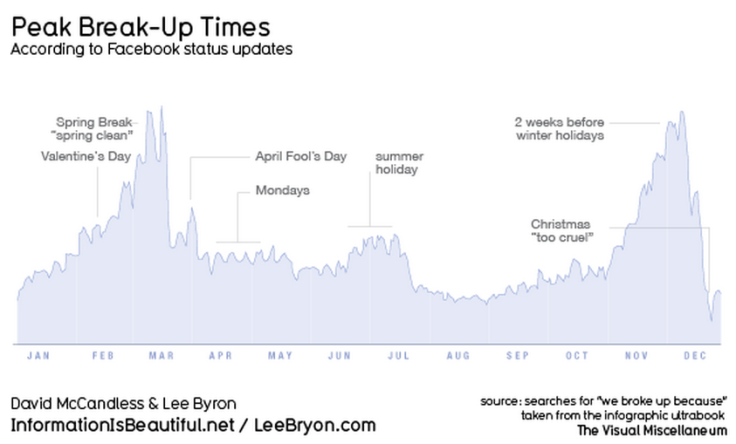
The chart below, created by David McCandless and Lee Byron from Information is Beautiful, shows which months people get dumped the most. The highest peaks for breakups are just after Valentine’s Day and a couple weeks before the holidays. Other breakup seasons are late-February to March and late-October to early December. Christmastime has one of the lowest breakup rates, since it’s considered “too cruel.”
McCandless and Byron first published the data in a book, The Visual Miscellaneum, which used charts, graphs, and other illustrations to detail the modern Information Age, or the wealth of facts made available today through everyday platforms like social media. Economist and mathematician Arthur Charpentier recently tweeted the 2008 graphic, causing it to make rounds again on the Web.
Do the fluctuations throughout the year still hold true? Take a closer look below:
Published by Medicaldaily.com


