How Healthy Is Your Air? American Lung Association Releases “State of the Air 2013”

How does your air fare?
Today the American Lung Association released its "State of the Air 2013." The report finds that the country has done well to reduce levels of particulate (soot) across the board, but that some of the most unhealthy cities had more unhealthy days this year than they did in 2012. In general, the report shows a continuation of the longstanding trend of increasingly healthy air.
The ALA also released a "Report Card" tool that you can use to see how healthy-- or unhealthy-- the air is by zip code.
Key findings of the study included that more than 131.8 million Americans, or 42 percent of the U.S. Population, live in counties with unhealthily high levels of either ozone or particle pollution.
Additionally, 24.8 million Americans, or 8 percent of the U.S. population, live in counties with all three negative health factors that were considered by the study: high ozone, as well as short-term and long-term particle pollution.
On the bright side, the annual report also found that 18 cities improved air quality, with lower year-round particle levels, including 16 cities achieving their lowest levels ever recorded.
"We are happy to report that the state of our air is much cleaner today than when we started the 'State of the Air' report 14 years ago," said Harold Wimmer, National President and CEO of the American Lung Association.
Wimmer added, "But the work is not done, and the Environmental Protection Agency must continue the work necessary to achieve the promise of the Clean Air Act; healthy air that is safe for all to breathe."
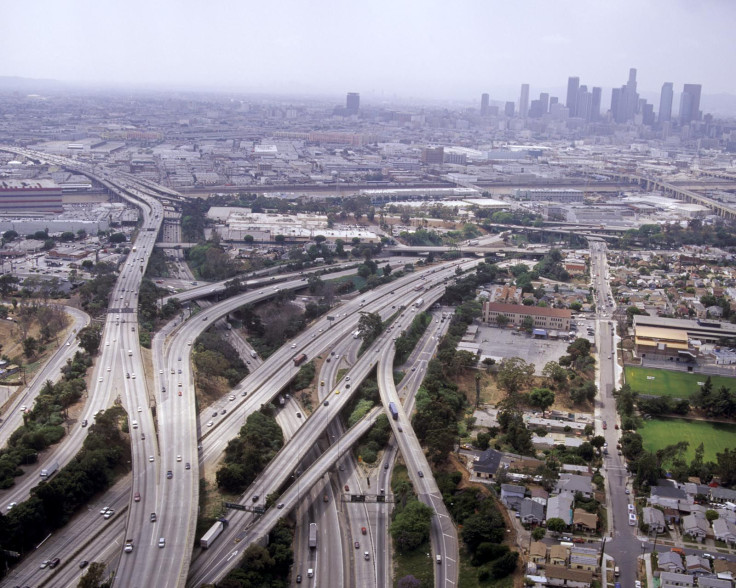
Some of the worst air quality rankings belonged to the state of California, especially in the central valley and Los Angeles.
Did your city make the "worst of" list?
Top 10 U.S. Cities Most Polluted by Short-term Particle Pollution
Metropolitan Statistical Areas
1. Bakersfield-Delano, Calif.
2. Fresno-Madera, Calif.
3. Hanford-Corcoran, Calif.
4. Los Angeles-Long Beach-Riverside, Calif.
5. Modesto, Calif.
6. Salt Lake City-Ogden-Clearfield, Utah
7. Pittsburgh-New Castle, Pa.
8. Merced, Calif.
9. Fairbanks, Alaska
10. Logan, Utah-Idaho
Top 10 U.S. Cities Most Polluted by Year-Round Particle Pollution
Metropolitan Statistical Areas
1. Bakersfield-Delano, Calif.
2. Merced, Calif.
3. Fresno-Madera, Calif.
4. Hanford-Corcoran, Calif.
5. Los Angeles-Long Beach-Riverside, Calif.
6. Modesto, Calif.
7. Visalia-Porterville, Calif.
8. Pittsburgh-New Castle, Pa.
9. El Centro, Calif.
10. Cincinnati-Middletown-Wilmington, Ohio-Ky.-Ind.
Top 10 Most Ozone-Polluted Cities
Metropolitan Statistical Areas
1. Los Angeles-Long Beach-Riverside, Calif.
2. Visalia-Porterville, Calif.
3. Bakersfield-Delano, Calif.
4. Fresno-Madera, Calif.
5. Hanford-Corcoran, Calif.
6. Sacramento-Arden-Arcade-Yuba City, Calif.-Nev.
7. Houston-Baytown-Huntsville, Texas
8. Dallas-Fort Worth, Texas
9. Washington-Baltimore-Northern Virginia, District of Columbia-Md.-Va.-W.Va.
10. El Centro, Calif.
Published by Medicaldaily.com


